Tasks & Logs
Two menu entries together form the observation and diagnostics centre. Tasks shows what's running or recently finished; Logs shows server-side logs for deeper troubleshooting.
| Area | Timeframe | Purpose |
|---|---|---|
| Tasks | now & recent | What's running, what just finished |
| Logs | hours to days | Server events, error messages |
Tasks
The Tasks entry lists every background job the server is currently or was recently processing — such as capturing a clone, building a Tools ISO, client updates or a playbook on multiple devices.
For each entry the table shows client / description, type, status (pending, running, completed, failed, cancelled — with an embedded progress bar for running tasks), created, duration and error (error text for failed tasks).
Filter and search
- Status — dropdown across all statuses (pending, running, completed, failed, cancelled).
- Type — dropdown to select the task class.
- Text search — by client or description name.
Actions
Tasks are managed directly in the table — there is no separate detail view. Each row offers icon actions depending on the status:
- Cancel — for running or pending tasks.
- Restart — for failed or cancelled tasks.
- Delete — for completed tasks.
If a task fails, the error text appears directly in the "error" column of its row.
Logs
Logs combines two views in two tabs:
- Audit log — who changed what and when. A paginated table of write accesses, filterable by action and path.
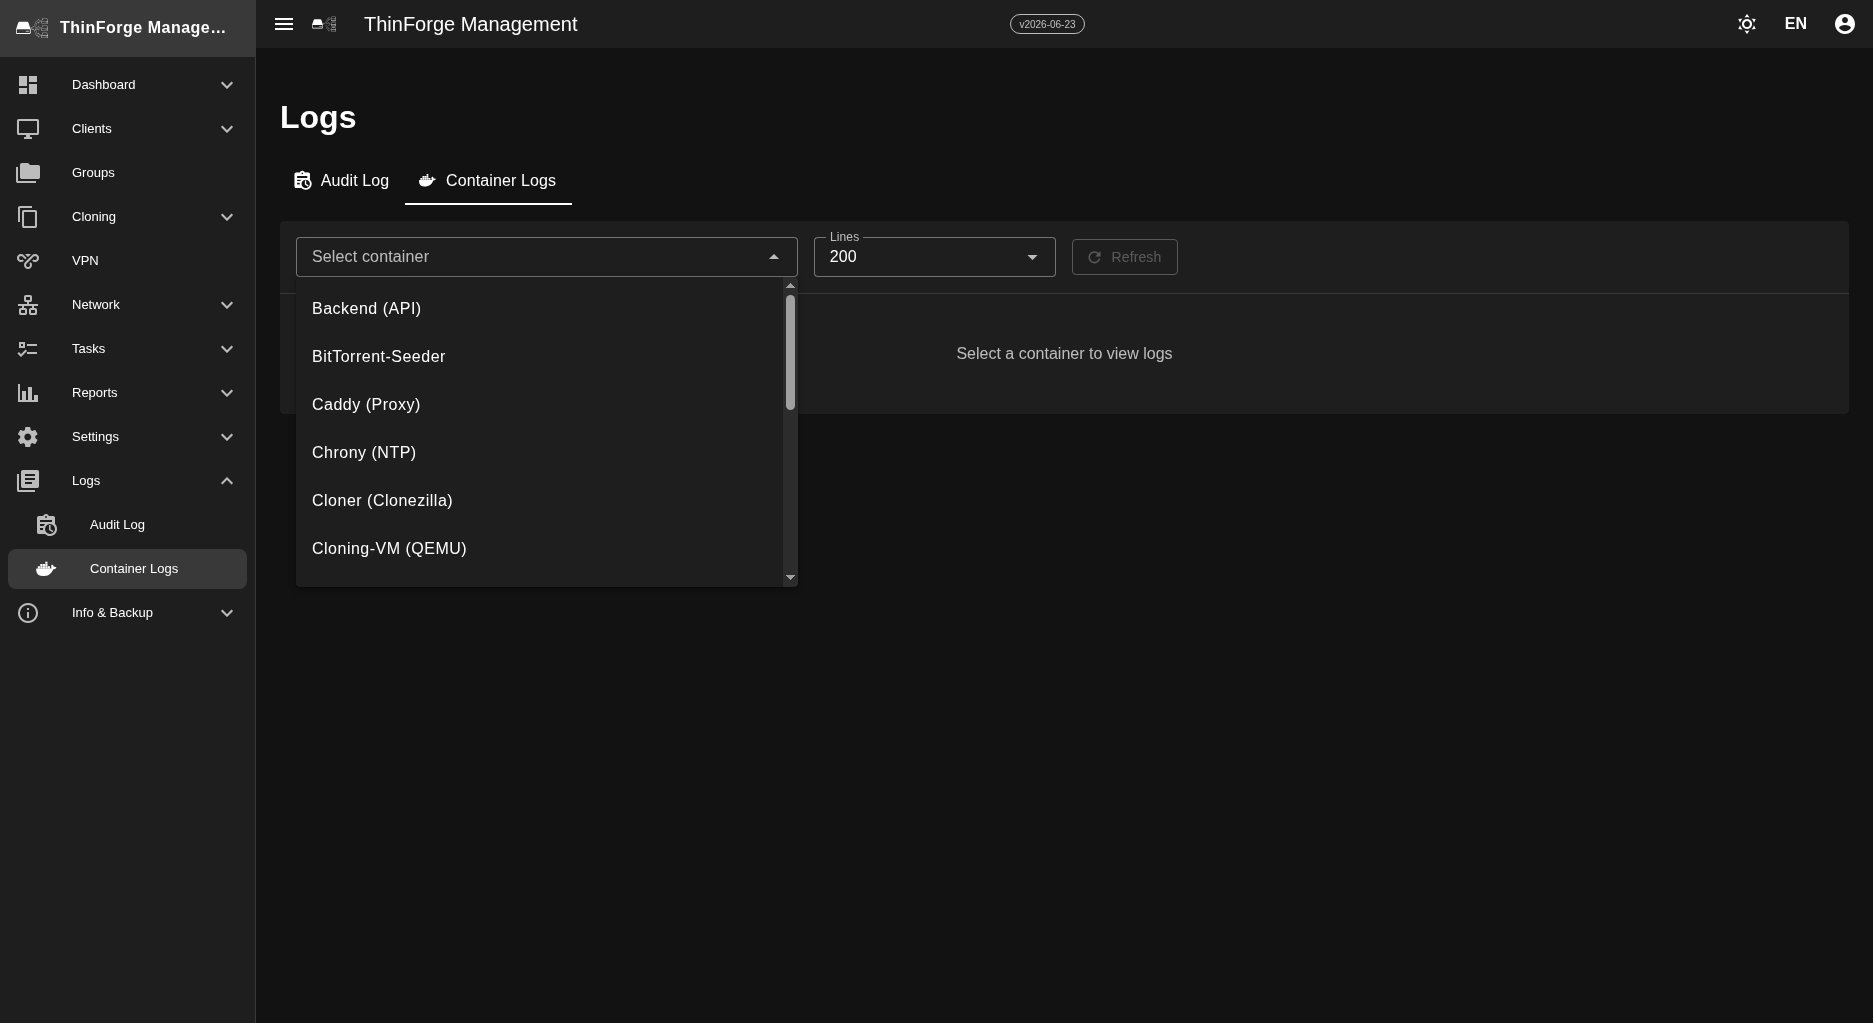
- Container logs — the logs of the ThinForge services, e.g. for internal messages, network events and access entries.
Container logs
The dropdown at the top selects which service is shown — among others the central controller, the background runner, DHCP/PXE events, the web proxy or VPN events. Sources whose service isn't currently running stay empty.
The view shows the most recent lines of the selected service. A second selector controls how many lines are loaded (100, 200, 500 or 1000 — default 200). A button refreshes the output manually.
Daily routine
- Dashboard first — skim the Dashboard cards.
- On anomalies check the tasks (running errors) first, then the logs (detail).
- Alerts appear as a card on the dashboard and can be acknowledged or resolved there.
To restart services or change configuration, continue to Settings.