Dashboard
The dashboard is the landing view after login. It gives a quick overview of system state, the active client fleet and running activity. Cards can be shown and hidden individually as well as reordered.
The cards
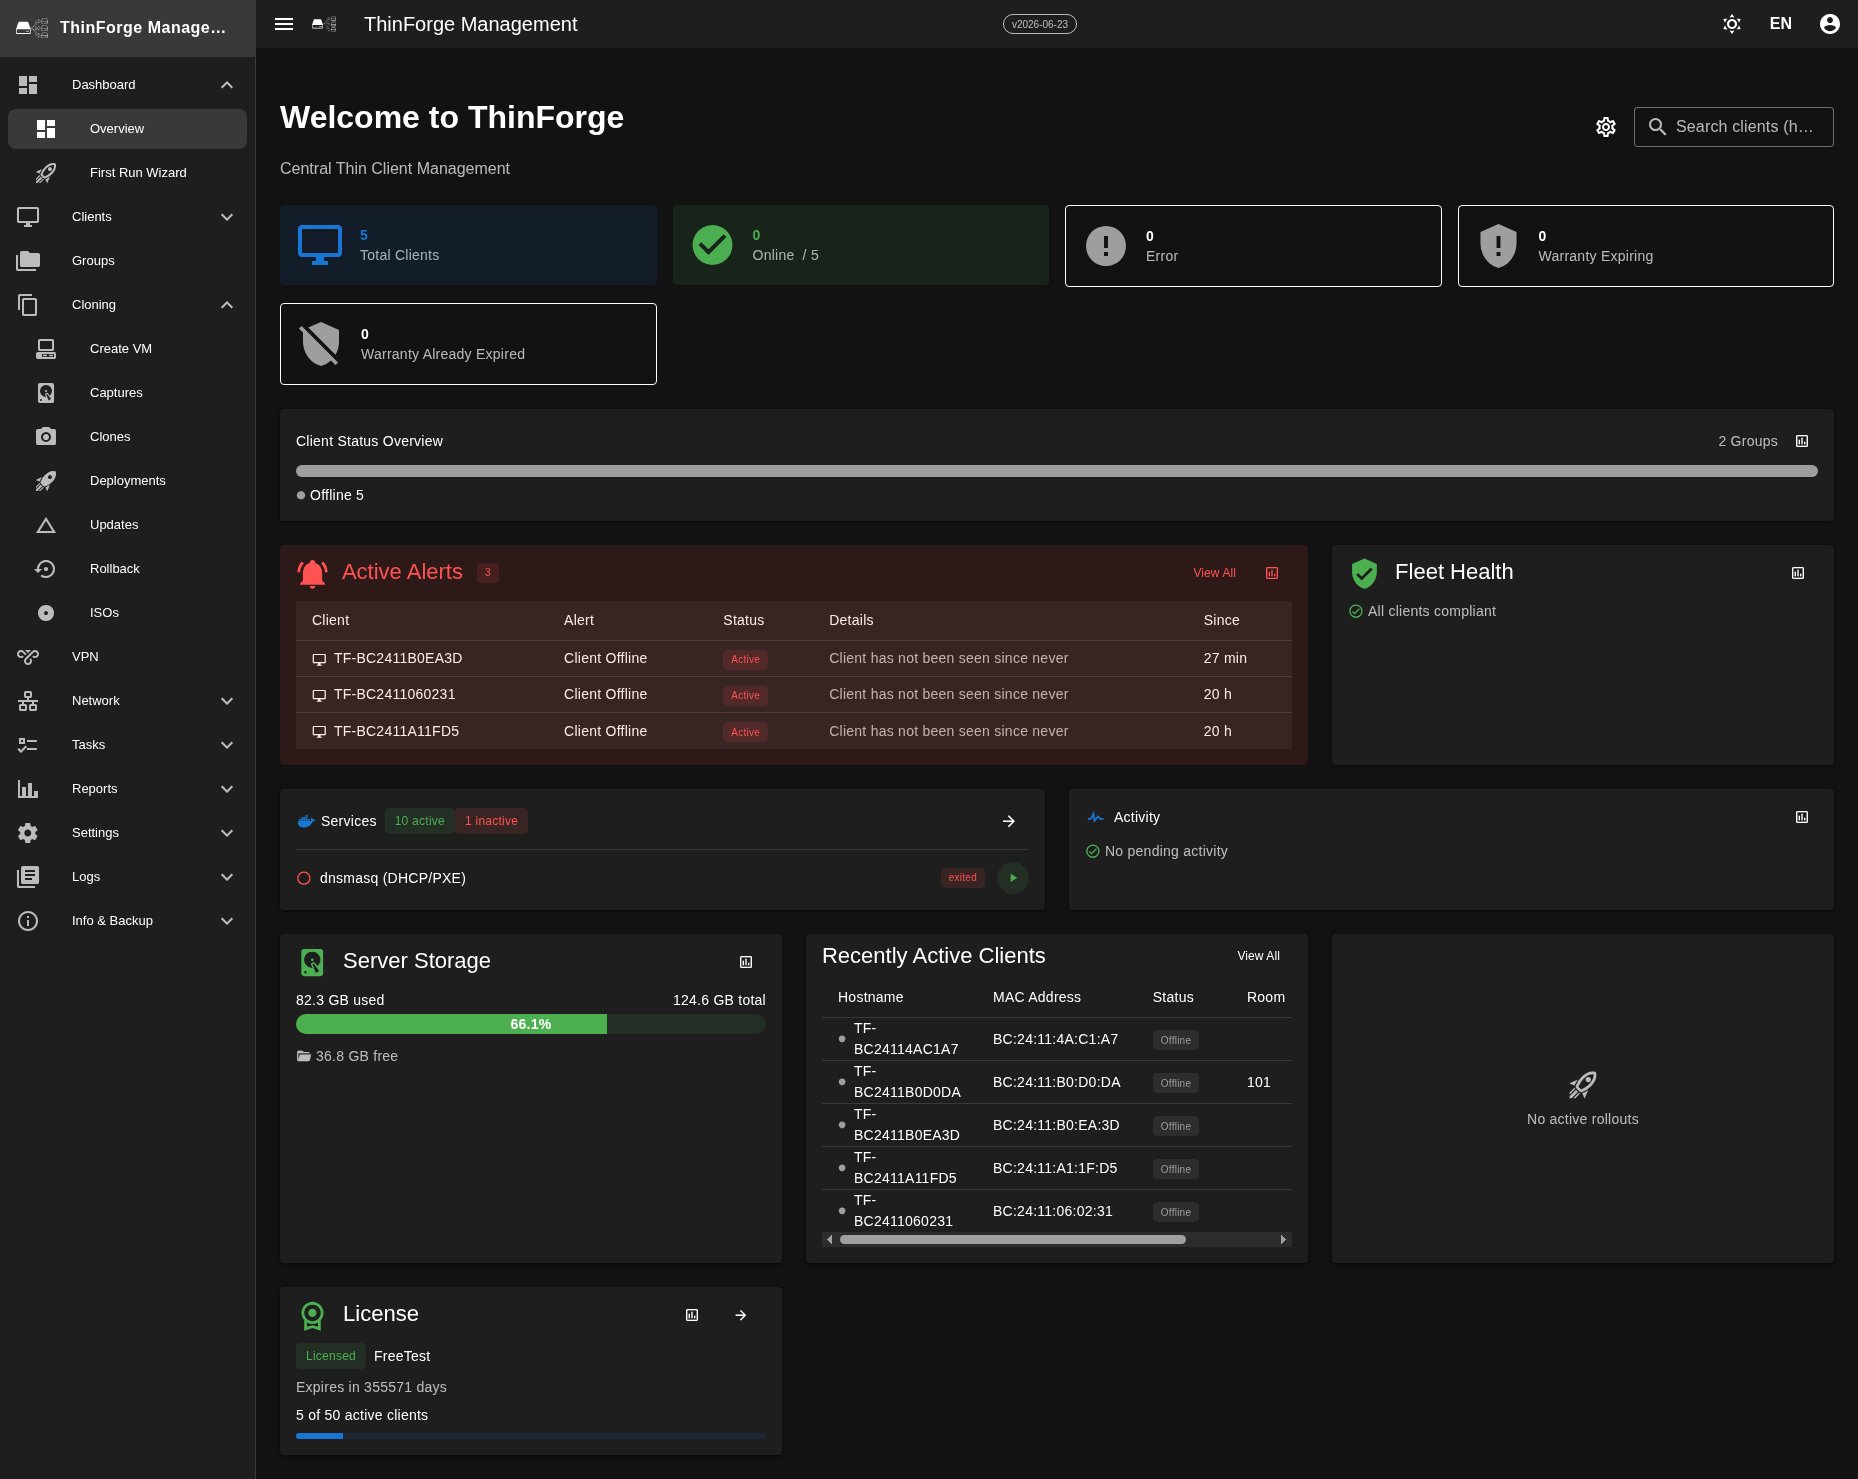
Each card shows one aspect of the system. A click usually takes you straight to the matching detail view.
- Services — service status: how many are active (green) versus unexpectedly inactive (red). Failed services are listed by name and can be restarted directly from the card.
- Client status bar — a visualisation of the fleet split by status. Only the Groups link and the availability report (report icon) are clickable. Filter the Clients list via its own status dropdown.
- Rollouts — active (and paused) rollouts with image and progress.
- System health — lists compliance issues: clients without a group, without an image, or with an expired warranty. The report button opens the compliance report.
- Alerts — open incidents (client, condition, status, since). Clicking opens the client detail view; Show all takes you to Settings → Alerts, where incidents can be acknowledged and resolved.
- Recent Clients — the devices that most recently became active, helpful after a large deployment.
- Disk Usage — the data folder's fill level. The bar turns red at 90 %, and amber at 75 % as a warning.
- Running Tasks — the number of running background jobs. A click takes you to the Tasks page.
Client status in detail
| Status | Colour | Meaning |
|---|---|---|
| Online | green | Last heartbeat under 5 minutes ago |
| VPN sync | light green | Online via VPN, configuration in sync |
| Offline | grey | No heartbeat |
| Cloning | orange | Client is currently installing an image |
| Error | red | Device reports an error state |
Customise the dashboard
The cog icon at the top right opens the dashboard settings:
- Show and hide individual cards
- Reorder them by dragging
- Reset to factory defaults
Settings are stored locally in the browser — so the customisation applies per device and browser, not across accounts.
Tips for daily use
Note: If the client status bar suddenly shows many "Offline" devices, there is usually a central network problem behind it (e.g. the VPN gateway is down or DHCP hiccups). A look at the Logs helps.
- If services appear as "inactive", check the services detail view first — right after a restart some services need a moment before they count as healthy.
- The status, alert and disk cards refresh roughly every 30 seconds. Rollouts, services, system health and recent clients, however, only update when you reload the page. If a rollout seems stuck, simply reload the page or open the detail view.